varistar
varistar manages and analyzes timeseries and lightcurve photometry for variable stars, coming from multiple survey sources (OGLE, TESS, Gaia DR3, or your own CSV/arrays).
Install
pip install varistar
# or
uv add varistar
Quickstart
Every workflow starts the same way: load photometry into a TimeSeries,
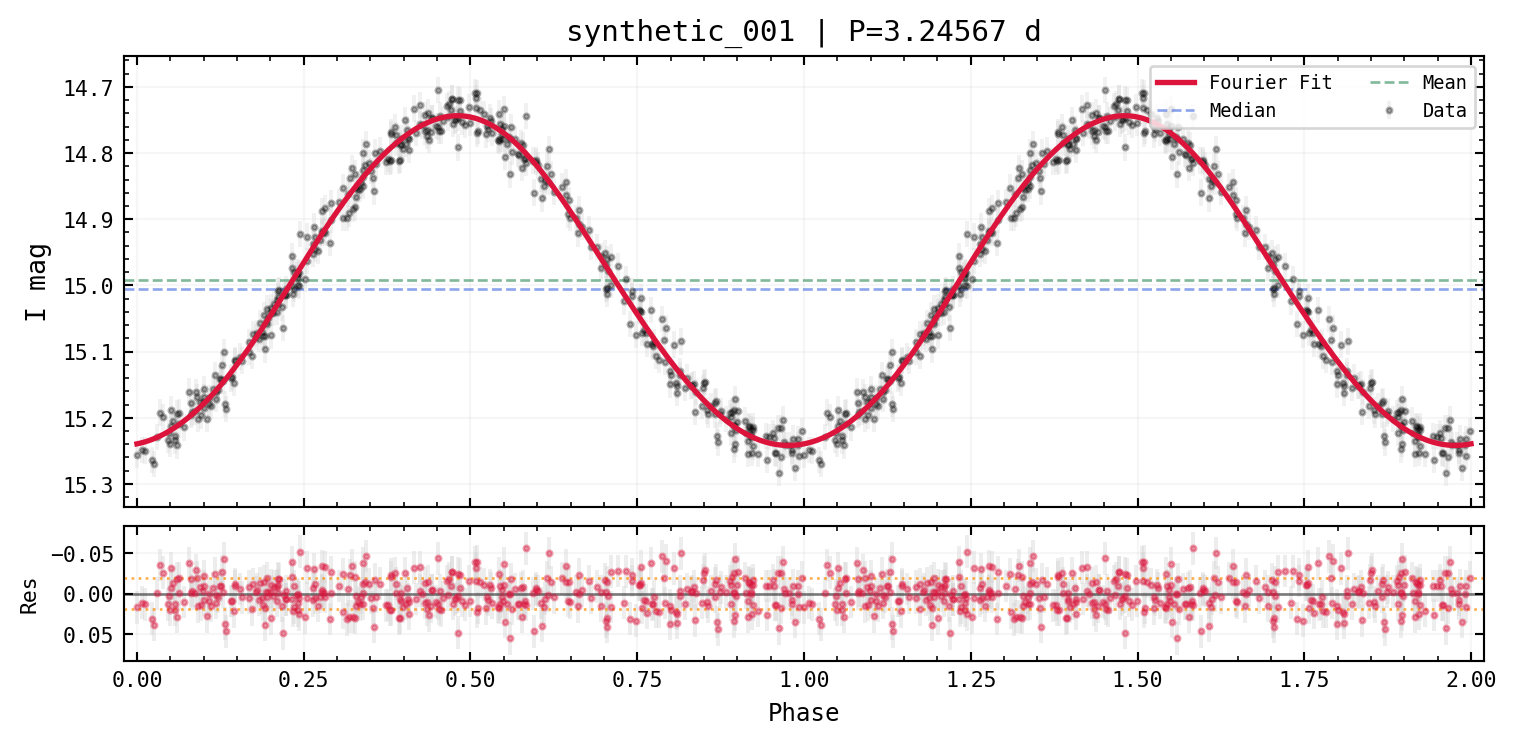
wrap it in a LightCurve, and let find_best_period + plot_best do
the heavy lifting.
from varistar import TimeSeries, LightCurve

# Using synthetic data here so this page runs standalone --
# see "Loading Data" for real survey files.
from _synthetic import make_sinusoidal_lightcurve

ts = TimeSeries(magnitude="mag I", time_scale="HJD")
ts.load_data_from_df(make_sinusoidal_lightcurve(), data_id="synthetic_001")

lc = LightCurve(ts)
lc.find_best_period()
lc.plot_best()
Where to go next
- Loading Data — OGLE
.dat, TESS, Gaia DR3, and plain CSV/arrays. - Cleaning & Statistics — outlier removal, binning, descriptive stats.
- Period Finding — Lomb-Scargle, PDM, PDM2, Spectrum Resampling.
- Phase Folding & Models — Fourier and Gaussian model fits.
- Classification — variability indices and eclipsing-binary detection.
- Batch Workflows —
TestGroupfor many stars at once. - ML Feature Pipeline — feature extraction and clustering.
- Visualization — publication styling and interactive plots.
- API Reference